Module 19. Evaluating Modern LLM Systems: From Benchmarks to Decisions
“Modern LLMs” course · Module 19 lecture · edition 2026.10.25
What this module is about. The earlier modules built the objects we now have to choose between: pretrained models, quantized serving stacks, retrieval systems, post-trained policies, multimodal models, and agents. Evaluation is the discipline that turns those artifacts into a release decision. It is not merely a leaderboard lookup. A defensible result joins a decision, a task distribution, an execution scaffold, a scoring rule, and a statement of uncertainty. We will follow a single practical question throughout the lecture: which of two candidate systems should a team deploy for a real product?
Public benchmarks will provide orientation, but the decision will eventually depend on paired outcomes, a private golden set, judge calibration, long-context diagnostics, operational cost, and continuous regression testing. Six numerical scenarios make those ideas concrete: assumed probabilities 95.5% and 95.0% at N=500, finite-sample
pass@k, a position-biased judge, confidence and selective answering, a synthetic working-context curve, and a costed private evaluation run.Prerequisites. Module 18 introduced agent scaffolds and trajectory logging; Modules 10 and 17 covered long context and retrieval; Module 15 introduced verifiers and test-time sampling. Every formula needed here is derived again, so the module can also be read on its own.
Reading routes
On a first pass, read Sections 1–6, 13, and 15. They connect a release decision to an inspectable report. In Section 6, work through the integer-outcome table before returning to the formulas; the small harness in Section 13 runs on its own.
On a second pass, examine how measurements fail: multiple attempts in Section 8, judges in Section 10, and context position in Section 12. Use Section 14 as a map of these experiments. Run both notebooks, change one assumption, and explain the resulting change in interpretation. Sections 7, 9, 11, 16, and 17 provide a reference for benchmark families and experiment passports. In Section 19, E1 completes the first route; E2–E3 use Sections 8, 10, and 12 and complete the second.
1. Evaluation is an instrument for a decision
Suppose a support organization is considering two candidate assistants. System A sits slightly higher on a public leaderboard. System B is cheaper, responds faster, and already integrates with the company’s refund tools. Which one should be released?
The question becomes difficult as soon as “better” must be operationalized. The deployed assistant must retrieve the right policy, avoid inventing rules, preserve state across turns, call tools with valid arguments, recover from tool failures, and finish the customer’s task under latency and cost limits. It must also handle rare but expensive mistakes, such as issuing an unauthorized refund.
No single public dataset represents that product contract. A knowledge benchmark may reveal academic breadth while saying little about tool state. A coding benchmark may test execution without testing customer communication. A human-preference arena may reward pleasant prose while missing a policy violation.
It helps to separate three objects.
- A model is a set of weights under a decoding configuration.
- A system adds prompts, retrieval, tools, retries, memory, and reasoning budget.
- A product places the system inside a real request distribution with business, safety, latency, and cost constraints.
Most benchmark numbers describe one particular system configuration. Release decisions concern the product.
This distinction yields the first governing rule of the module:
Begin with the decision that the evaluation must support.
A model-selection study, a prompt-regression test, and a safety gate need different evidence. Even when they use the same examples, they may require different primary metrics and different stopping rules.
The second rule is that averages hide structure. Two systems can have identical overall accuracy while failing on different slices. One may be uniformly mediocre; another may excel on common requests and fail catastrophically on a rare financial workflow. Those outcomes are not interchangeable.
The third rule concerns uncertainty. A half-point difference can represent a real improvement or two examples that happened to flip. Any score intended to support a decision should arrive with the sample size, the protocol, per-example outcomes, and an uncertainty estimate.
By the end of the module, the public leaderboard will have become only the first page of a much larger evidence package.
2. The historical arc: every evaluation regime repaired a failure
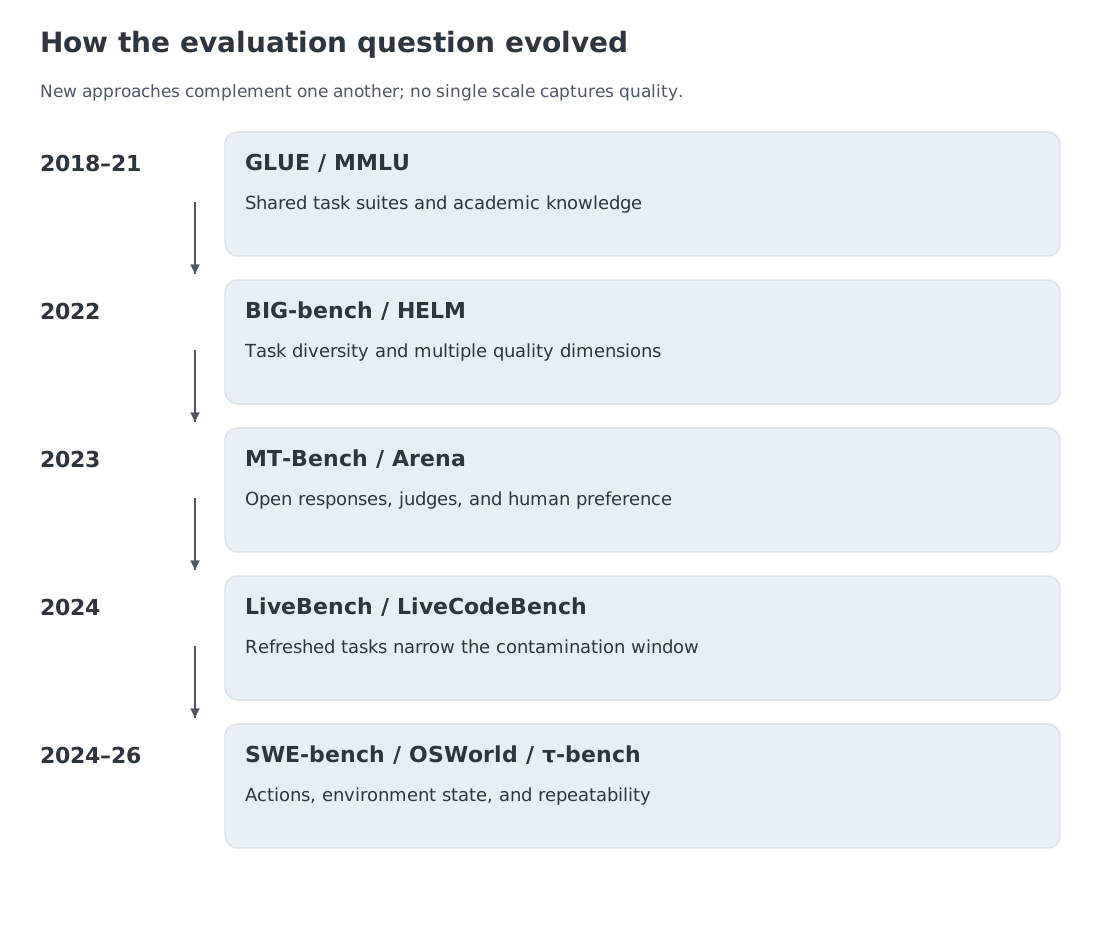
Modern LLM evaluation did not replace one canonical benchmark with another. It accumulated layers as older instruments stopped answering new questions.
GLUE — General Language Understanding Evaluation standardized a basket of language-understanding tasks in 2018. SuperGLUE increased the challenge soon afterward. The attraction was obvious: one common suite made research comparisons possible.
MMLU — Massive Multitask Language Understanding broadened the idea to 57 academic subjects. Its aggregate score became a compact proxy for general knowledge and problem solving. For the models of its era, it was discriminative and easy to report.
The first major limitation was dimensionality. One mean score could conceal radically different capability profiles. BIG-bench — Beyond the Imitation Game Benchmark assembled 204 diverse tasks, while HELM — Holistic Evaluation of Language Models made the evaluation matrix explicit: scenarios crossed with accuracy, calibration, robustness, efficiency, fairness, and other desiderata.
The next limitation was open-ended quality. A dialogue response rarely has one exact reference. MT-Bench — Multi-Turn Benchmark explored strong LLMs as evaluators, and Chatbot Arena collected pairwise human preferences. These approaches made conversational quality measurable at scale, but introduced judge bias, population dependence, and ranking uncertainty.
Static public test sets then encountered contamination and saturation. LiveCodeBench continuously sources new programming problems. LiveBench refreshes objective, automatically scored tasks from recent information sources. Freshness narrows the window for memorization, although no published set remains protected indefinitely.
A further shift occurred when models became agents. SWE-bench — Software Engineering Benchmark asks a system to modify a real repository. OSWorld evaluates work in a computer environment. -bench evaluates conversations in which an agent must obey policies and manipulate a database through tools. The object of evaluation is now a trajectory and its final state, not a short answer.
Finally, harder benchmarks restored headroom at the frontier. MMLU-Pro, Humanity’s Last Exam, FrontierMath, and ARC-AGI — Abstraction and Reasoning Corpus for Artificial General Intelligence, including ARC-AGI-2 and the interactive ARC-AGI-3 create difficulty through different mechanisms: expert knowledge, unpublished mathematics, novel abstraction, or interaction with a new environment.
The useful historical lesson is not “newer is always better.” Each benchmark family answers a different question and fails in a different way. A contemporary evaluation stack therefore combines broad public orientation, capability-specific probes, trajectory tasks, and private product evidence.
3. Classical measurement theory already knows most of the problems
Three older disciplines provide a more reliable vocabulary than leaderboard folklore.
Psychometrics: difficulty and discrimination
In test theory, an individual question is an item. Items differ not only in difficulty but also in how well they separate stronger from weaker test takers. An item that nearly everyone answers correctly may remain pedagogically valid while contributing almost no information near the top of the ability range.
That is the ceiling effect. It does not begin at one universal percentage. The useful range depends on the number of items, annotation noise, item heterogeneity, and correlation between systems’ mistakes. The practical implication is simple: a thousand easy questions need not distinguish frontier systems as well as a much smaller, carefully constructed set of difficult items.
IRT — Item Response Theory formalizes the relationship between latent ability and item response probabilities. We will not fit an IRT model here, but its perspective is valuable: benchmark composition matters as much as benchmark size.
Experimental design: exploit pairing
Two systems are normally evaluated on the same items. Their outcomes are therefore paired. The strongest evidence lies in disagreements: items solved only by A versus items solved only by B.
McNemar’s test uses precisely those discordant counts. Two aggregate accuracies cannot recover that information because they discard covariance. This is why an evaluation harness should retain per-example results rather than only the final mean.
Good experimental practice also includes pre-registering the primary metric, freezing the protocol before inspecting results, and keeping a held-out set for final decisions.
Software testing: evaluate at multiple levels
A benchmark suite resembles a software test hierarchy.
- A small isolated question behaves like a unit test.
- A prompt plus retrieval or a tool call resembles an integration test.
- Completing a user workflow in an environment is an end-to-end test.
- A private suite run on every change becomes a regression test.
“Percentage of tests passed” is useful, but an engineer still needs logs, failure categories, slices, and reproducible environments. LLM systems require the same discipline, with the added complication that outputs may be stochastic and external judges may themselves be fallible.
Throughout this module, raw records and trajectories come first. Aggregates are derived artifacts.
4. How a benchmark loses measurement power
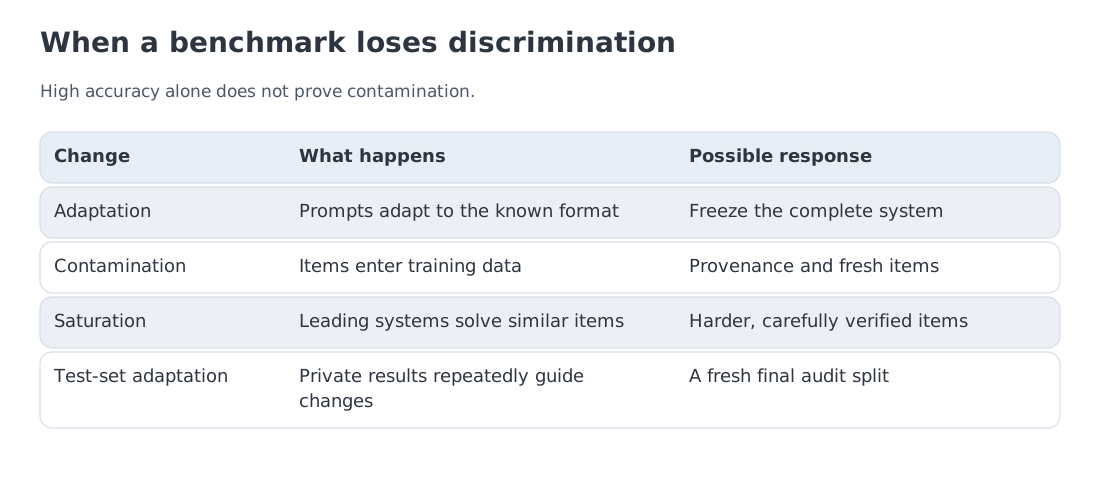
A new benchmark usually begins with ample headroom. Current systems fail in diverse ways, and score differences are large enough to be informative. Success changes the benchmark.
First, developers optimize the protocol: prompts, few-shot examples, answer extraction, retries, tools, and reasoning budget. Such tuning is legitimate when disclosed and applied consistently. Yet the score increasingly describes “model plus scaffold” rather than the weights alone.
Second, benchmark items spread through repositories, papers, tutorials, synthetic datasets, and training mixtures. Contamination becomes plausible. A high score can reflect the intended capability, recall of the exact item, or familiarity with a close variant. The aggregate result alone cannot distinguish those mechanisms.
Third, systems converge near the item ceiling. The leaderboard may still look precise, but rankings hinge on a small number of ambiguous or noisy questions. At this stage, item auditing and paired outcomes matter more than another decimal place.
The field responds in several ways.
- Harder successors. MMLU-Pro expands answer choices, removes some trivial or noisy questions, and emphasizes reasoning.
- Living benchmarks. LiveBench and LiveCodeBench add fresh, objectively scored material over time.
- Private hold-outs. Organizers reveal the task family while retaining evaluation items; ARC-AGI uses private evaluation.
- Unpublished expert problems. FrontierMath was constructed from original problems with automated verification.
- Counterfactual or mutated items. Surface details change while the target skill remains testable.
- Trajectory evaluation. The system must change an environment rather than emit one answer.
Hardness does not guarantee item quality. Humanity’s Last Exam contains 2,500 expert-created multimodal questions, yet later HLE-Verified work investigated ambiguity, answer errors, and rationale mismatches. A difficult item can still be defective.
The benchmark passport should therefore document provenance, update policy, held-out structure, annotation review, and the handling of disputed items—not merely the observed score range.
5. Build an evaluation map before choosing benchmark names
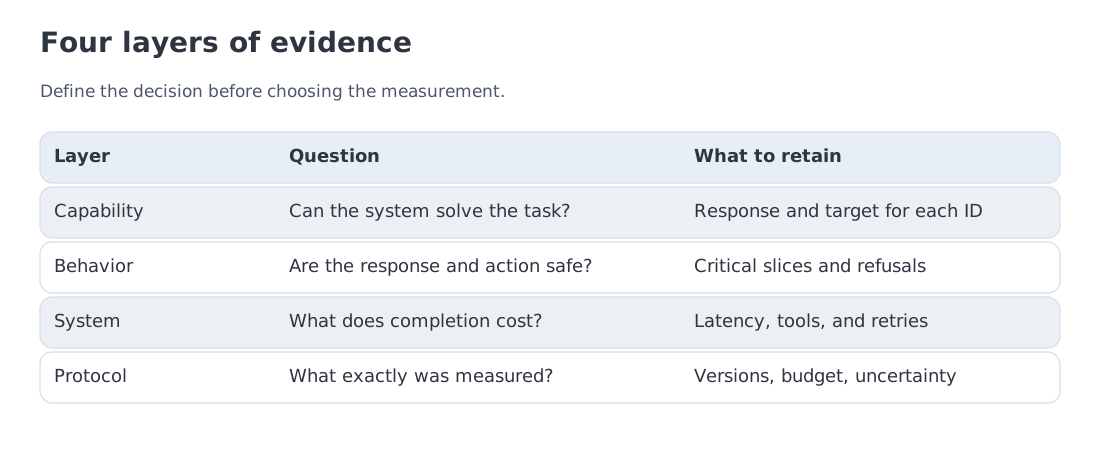
Return to the support-assistant decision. A useful plan separates four layers.
Layer 1: capabilities
This layer contains knowledge, reasoning, code, vision, long-context use, and tool interaction. Representative instruments include:
- MMLU-Pro, GPQA — Graduate-Level Google-Proof Q&A, and Humanity’s Last Exam for broad or expert academic tasks;
- FrontierMath and ARC-AGI-2 for specialized forms of difficult reasoning;
- LiveCodeBench for fresh programming problems;
- SWE-bench, OSWorld, and -bench for actions in environments;
- RULER — What’s the Real Context Size of Your Long-Context Language Models?, NoCha, and LongBench v2 for different long-context requirements;
- VHELM — A Holistic Evaluation of Vision Language Models for a multidimensional view of vision-language systems.
These are not interchangeable rungs on one intelligence ladder. They differ in task object, interaction model, tools, and evaluation cost.
Layer 2: behavior, safety, and honesty
Instruction following, refusal behavior, robustness under attack, truthfulness, calibration, and honesty can move independently. HarmBench studies red-teaming and robust refusal. TruthfulQA probes imitation of common falsehoods. MASK — Model Alignment between Statements and Knowledge distinguishes accuracy of belief from honesty of reporting.
A single capability average should not absorb these axes.
Layer 3: operational properties
A user experiences time to first token, inter-token latency, cost, tool failure rate, repeatability, and task-completion time. Those metrics belong to the deployed system and can change when prompts, retrieval, retries, or reasoning effort change.
Layer 4: evidence protocol
The observed result depends on the system prompt, decoding parameters, permitted tools, retry policy, scaffold version, answer extraction, judge rubric, and reasoning budget. A report that omits them is not reproducible.
A pragmatic model-selection package contains four kinds of evidence:
- public capability benchmarks relevant to the use case;
- a private golden set sampled from product traffic;
- operational measurements on the target serving stack;
- a separate safety and critical-edge-case evaluation.
The output is a decision dossier rather than one universal score.
Confidence, calibration, and the option to abstain
A document assistant needs more than an average accuracy figure. It may be useful to send a difficult question to a person rather than return an incorrect instruction. To design that choice, first specify what confidence refers to. The token probability from Module 3 describes the next piece of text given its context. A familiar sequence can be highly probable and factually wrong. Likewise, “I am certain” is a generated statement until its reliability has been tested.
Let estimate the probability that the complete response to item will pass a declared correctness check. The check supplies an outcome . A verifier, agreement among attempts, or a trained predictor might supply ; none is automatically a trustworthy probability estimator. Assess the estimates on data kept out of their construction and tuning.
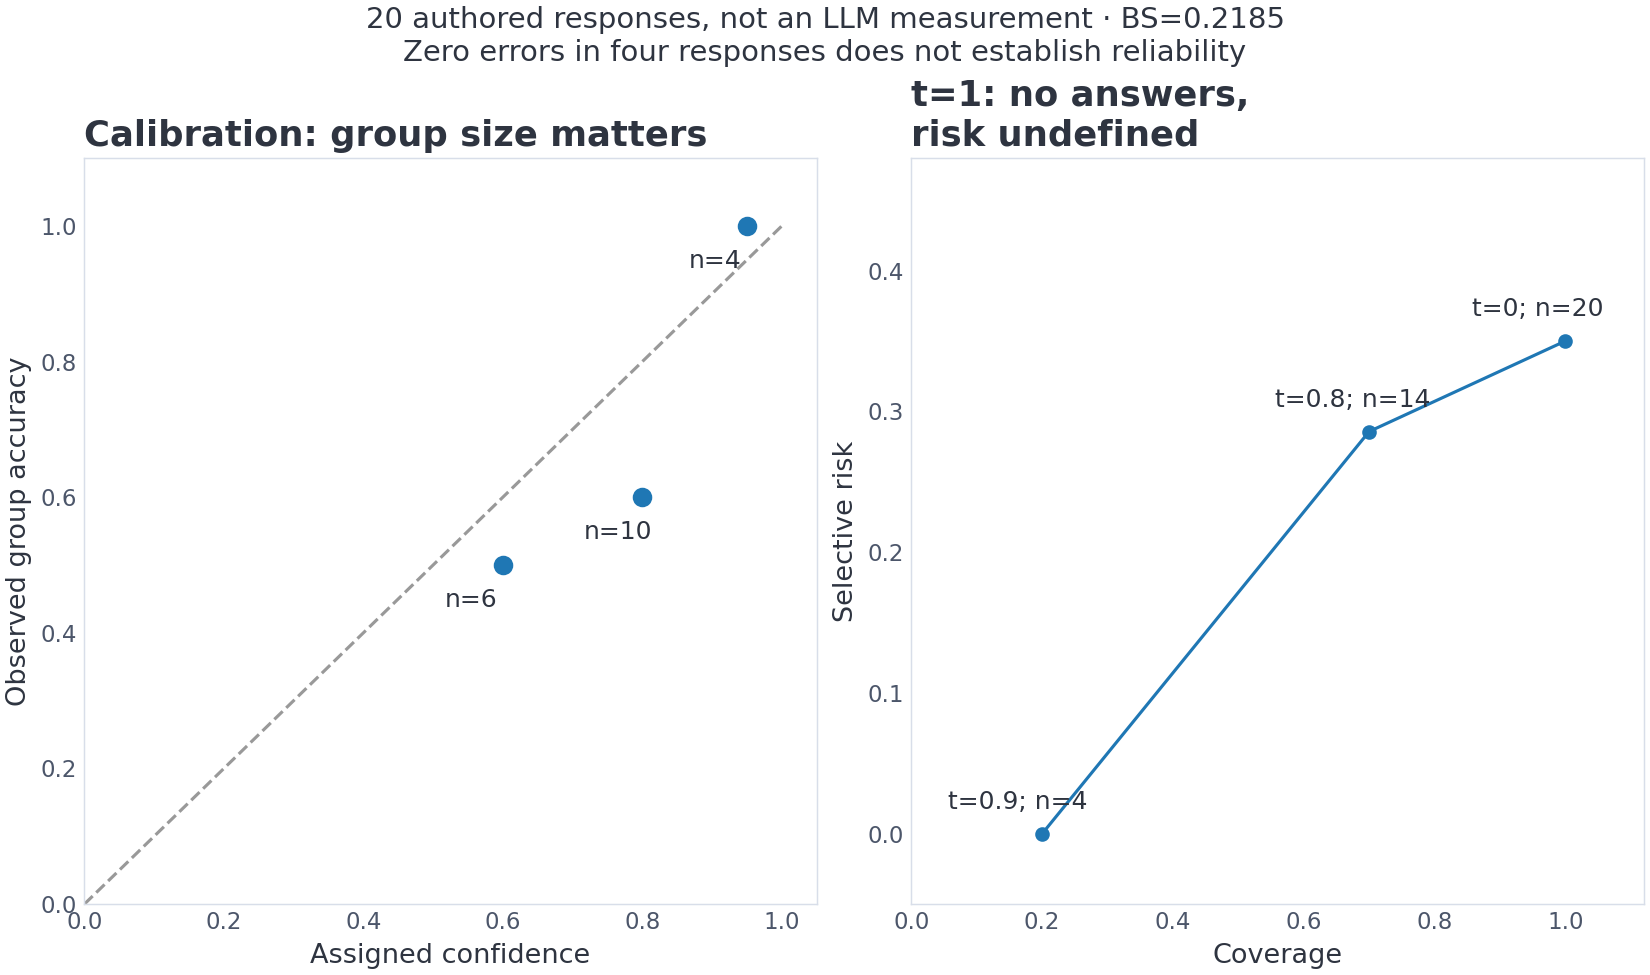
Calibration asks whether stated probabilities agree with success frequencies. Among responses assigned confidence near 0.8, roughly 80% should be correct. The population condition is . A finite evaluation estimates this relationship by grouping nearby scores under a declared binning rule. Report group sizes: three successes in three trials cannot establish certainty. This interpretation follows the calibration framework discussed by Guo et al. (2017).
Consider ten authored response records, each carrying confidence 0.8, of which six are correct. The observed success rate is 0.6. The group suggests overconfidence, subject to sampling uncertainty. The Brier score evaluates probability estimates through squared error:
Here the score is . Assigning 0.6 to every record would give 0.24 on these same outcomes. That retrospective calculation illustrates the loss; it does not validate a calibrator fitted to the test set. If the true success probability is , the identity shows why the expected score is minimized at . Brier score measures overall probability-prediction quality, not calibration alone. A constant base-rate prediction can be calibrated yet fail to distinguish easy items from hard ones.
We can now define a decision rule: accept a response when , and otherwise abstain or request review. This is selective prediction. For the accepted set , define coverage and selective risk, the error rate among accepted responses, as
Coverage here is the fraction of tasks answered; it is distinct from the probability of finding at least one correct candidate in Module 15. An empty accepted set has undefined risk, not zero risk. Raising the threshold cannot increase coverage, but it need not lower risk if confidence ranks errors poorly. Geifman and El-Yaniv (2017) study prediction with this option to reject part of the input population.
The notebook uses 20 authored records: four successes out of four at confidence 0.95, six out of ten at 0.8, and three out of six at 0.6. Overall accuracy is 13/20 and Brier score is 0.2185. Threshold 0.8 accepts 14 responses, including four errors: coverage is 70% and risk is . Threshold 0.9 accepts four correct responses. Its observed risk is zero, but four cases establish little about future failures, and 80% of requests now need another route. Choose a threshold on separate development data, accounting for both errors and handoffs; evaluate it on held-out data and critical slices. Calibration and abstention also leave the authorization checks from Module 18 fully necessary.
6. Worked example A: what does half a percentage point mean?
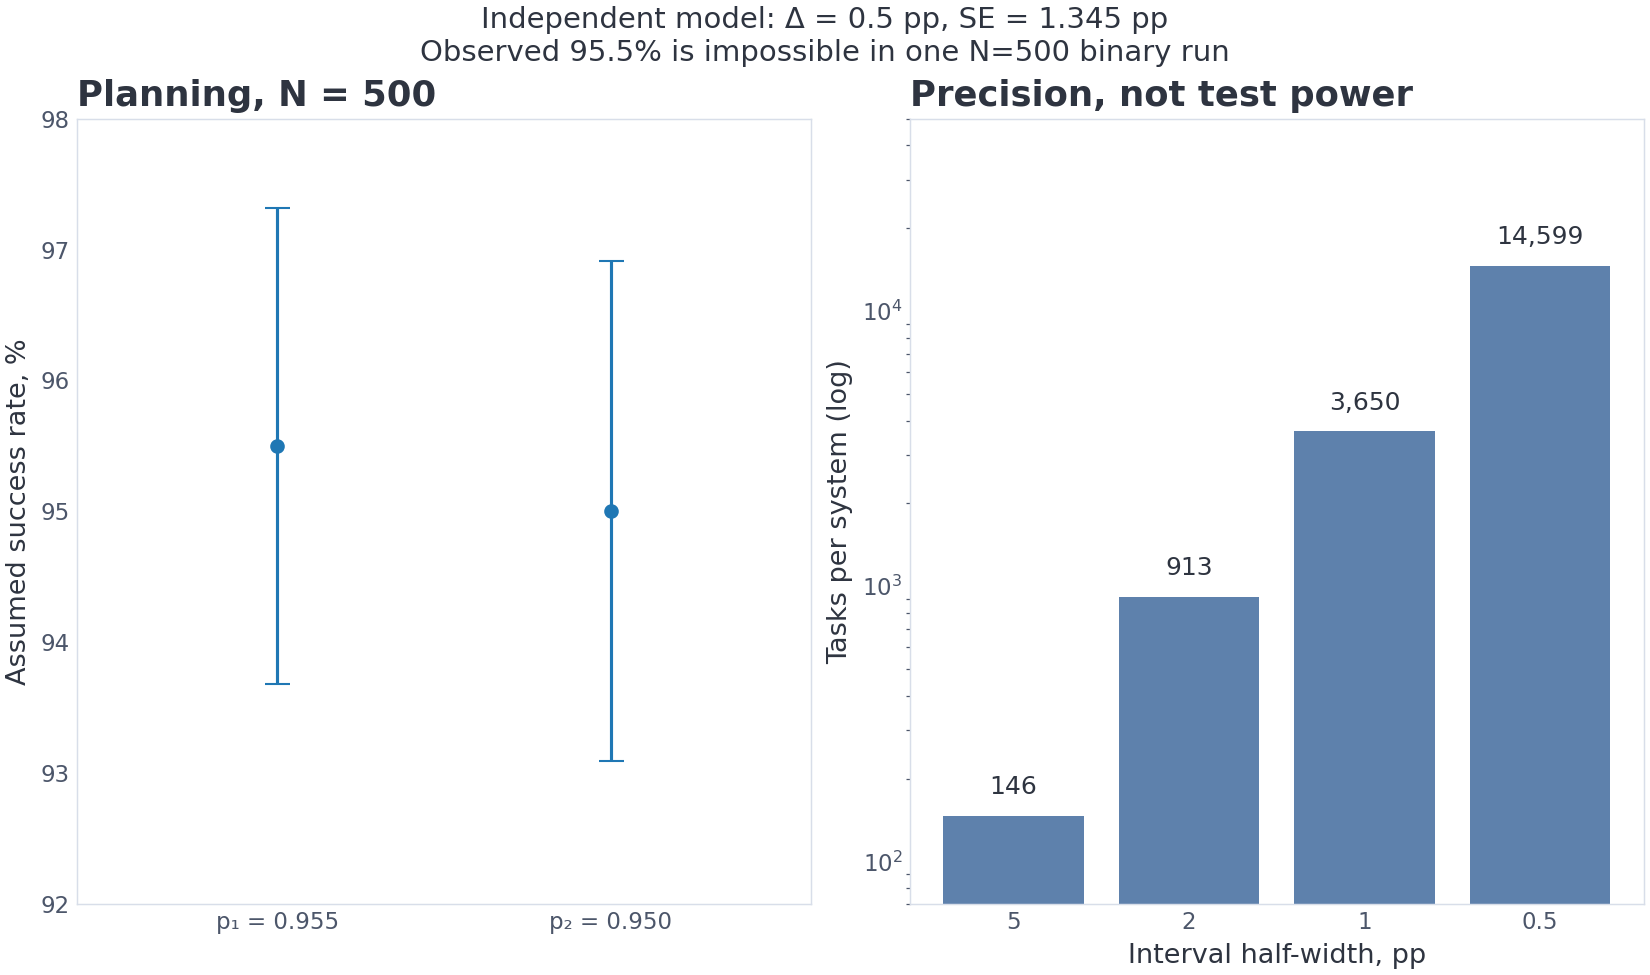
Start with a planning assumption, not an observed leaderboard result. Suppose success probabilities are and , and we plan binary tasks per system. These are valid probabilities, but 95.5% cannot be the accuracy of a single 500-item binary run: the resolution is , or 0.2 percentage points. It would require 477.5 successes. Actual counts of 478 and 475 would give 95.6% and 95.0%, a 0.6-point difference.
The tasks selected for an evaluation introduce sampling variation. A standard error (SE) describes the typical spread of an estimate across repeated samples. For independent binary outcomes, the standard error of a proportion is . Planning uses an assumed probability ; analysis often substitutes the observed proportion .
For two independent samples, variances add:
That is 1.345 percentage points. The assumed difference is only
standard errors. A normal 95% confidence interval uses an estimate plus or minus . Under this planning scenario, its approximate half-width is 2.64 points, much larger than the assumed 0.5-point effect. An actual interval must use observed data. The 95% coverage refers to repeated applications of the procedure to fresh samples; it is not a probability assigned to the fixed parameter after this particular interval has been computed.
Keep the task pairs
Usually both systems answer the same tasks, so their outcomes are related. The independent formula cannot recover that relationship. Store the counts for both correct, A only, B only, and both wrong.
| Paired scenario, N=200 | Both correct | A only | B only | Both wrong | Accuracy A / B |
|---|---|---|---|---|---|
| I | 150 | 20 | 10 | 20 | 85% / 80% |
| II | 160 | 10 | 0 | 30 | 85% / 80% |
The null hypothesis of exact McNemar inference gives equal probability to the two directions of disagreement. Scenario I has 30 disagreements, 20 favoring A. Its two-sided value is
Here counts successes in independent trials with probability . A p-value describes how likely an equally or more extreme deviation is under the null; it is not the probability that the null is true. In scenario II all ten disagreements favor A, giving . The aggregate accuracies are identical, yet the evidence differs. At this fixed difference, fewer discordant outcomes provide stronger evidence. Failing to reject the first null does not establish equivalence.
A paired bootstrap can estimate an interval for the difference: repeatedly sample whole rows, each containing both outcomes, with replacement; recompute the difference; take, for example, the 2.5th and 97.5th percentiles. The project notebook does this from saved responses. When multiple rows share a document or session, resample independent groups rather than pretending every row is independent.
Plan the precision you need
For two independent proportions near , targeting an interval half-width gives
At , rounding up gives 146, 913, 3650, and 14,599 tasks per system for half-widths of 5, 2, 1, and 0.5 points. This does not guarantee 80% or 90% power to detect an effect of that size. Power is the probability of rejecting the null under a specified true alternative; planning it is a separate calculation that must also account for pairing. The useful lesson here is the precision cost: grows as .
For a single observed proportion on a small dataset, we use a Wilson interval. With successes out of , , and , its endpoints are
Seven successes out of eight give 87.5% accuracy but an interval of approximately [52.9%, 97.8%]. That breadth is part of the result. Even zero observed errors does not prove perfect reliability. No interval can repair an unrepresentative sample or an incorrect independence assumption; statistical analysis comes after experimental design.
7. Difficulty has several sources: HLE, FrontierMath, and ARC-AGI
A benchmark can be difficult because it demands expert knowledge, because its problems are novel, because the system must infer an abstract rule, or because it must learn through interaction. Those forms of difficulty should not be collapsed.
HLE — Humanity’s Last Exam contains 2,500 multimodal questions contributed by subject-matter experts across many fields. Its challenge comes from broad, high-level expertise under automatically gradable answer formats.
FrontierMath contains hundreds of original, previously unpublished mathematical problems. Some require hours or days of work by specialists, and answers are constructed for automatic verification. Novelty and research depth are the main barriers.
ARC-AGI-2 — Abstraction and Reasoning Corpus for Artificial General Intelligence asks systems to infer transformations from a small set of demonstrations and applies private evaluation under efficiency constraints. Its ambition is skill acquisition on unfamiliar abstract tasks rather than recall of domain knowledge.
ARC-AGI-3 changes the object again. A system explores interactive environments, discovers goals, forms a world model, and acts. Difficulty is expressed through a trajectory.
These benchmarks can produce different system rankings without contradiction. A system with mathematical tools may excel on one; a system with stronger adaptation may excel on another.
Hard benchmarks also introduce measurement costs:
- small samples yield wide uncertainty;
- expert labels are difficult to audit;
- private items reduce transparency;
- tools and inference budget can dominate the weights;
- rapid progress begins another saturation cycle.
A serious report pairs the score with item count, private/public split, verification procedure, allowed tools, cost limits, and retry policy.
8. pass@k: finding one solution is not the same as being reliable
When tasks are automatically verifiable, a system may generate several candidates. Given stored samples of which are correct, the finite-sample unbiased estimator for at least one success among draws is
The formula has two connected interpretations. Conditional on a fixed pool of candidates, the ratio is the chance of selecting failures without replacement. If that pool was itself generated by independent draws from a fixed sampling policy, the estimator has expectation , where is the unknown single-attempt success probability. That is the sense in which it is unbiased. Copying one generation, selecting favorable candidates before counting, or changing temperature within the pool breaks this justification.
Compute the estimate separately for each task, then average with declared weights. Pooling successes and samples from heterogeneous tasks into a single pair changes the estimand. The implementation checks and , including no successes and fewer than failures.
For and :
unbiased pass@k | plug-in | |
|---|---|---|
| 1 | 0.2000 | 0.2000 |
| 5 | 0.7183 | 0.6723 |
| 10 | 0.9567 | 0.8926 |
The formulas agree at one sample. At ten, the plug-in estimate is lower by roughly 6.4 percentage points because it treats the noisy observed rate as the true probability.
A large pass@1 to pass@10 gap indicates that the model can often produce a correct candidate somewhere in the sample set. Turning that headroom into a product improvement requires a verifier that can identify the correct candidate without access to the hidden reference.
Do not confuse pass@k with , a reliability-oriented metric used in agent evaluations such as -bench. pass@k asks whether at least one of attempts succeeds; it rises with . asks for consistent success across repeated trials and normally falls as grows.
A complete pass@k report includes the number of generated samples, decoding parameters, verifier, aggregation rule, estimator, and generation cost.
9. Human arenas and composite indices answer someone else’s question
Open-ended assistant quality is naturally comparative. Arena (formerly LMArena and Chatbot Arena) presents two anonymous outputs and asks a user which one they prefer. A Bradley–Terry model converts many pairwise votes into a ranking.
The platform supplies valuable evidence because prompts come from real users and no exact reference answer is required. Yet the resulting ranking describes the arena population and protocol. It is not automatically the utility function of your organization.
Rankings depend on topic and language mix, model exposure, user heterogeneity, response length, presentation, model revisions under stable names, and statistical robustness of the aggregation.
This does not make arenas useless. It makes their scope explicit: they are broad human-preference instruments.
Bradley–Terry assigns each system a strength parameter and models , with . Only differences matter: adding the same constant to all strengths changes no probability. Ties and heterogeneous preferences require protocol rules or extensions. Rating parameters are therefore not task-success percentages.
Composite indices introduce another layer. If
then changing the weights can change the winner without changing any component score. The index answers the designer’s weighted question.
A composite is helpful for generating a shortlist when components and weights are visible. It is weak evidence for a specific deployment until the relevant axes are unpacked.
A defensible workflow is:
- use arenas and composites for landscape navigation;
- inspect component tasks and protocols;
- select evidence relevant to the product;
- make the final decision on private data and the target system stack.
10. LLM judges: a synthetic 30-point illusion
Using an LLM as a judge makes rubric-based evaluation inexpensive and scalable. The judge is still a model. MT-Bench documented position, verbosity, and self-enhancement biases, and subsequent work has studied those effects systematically.
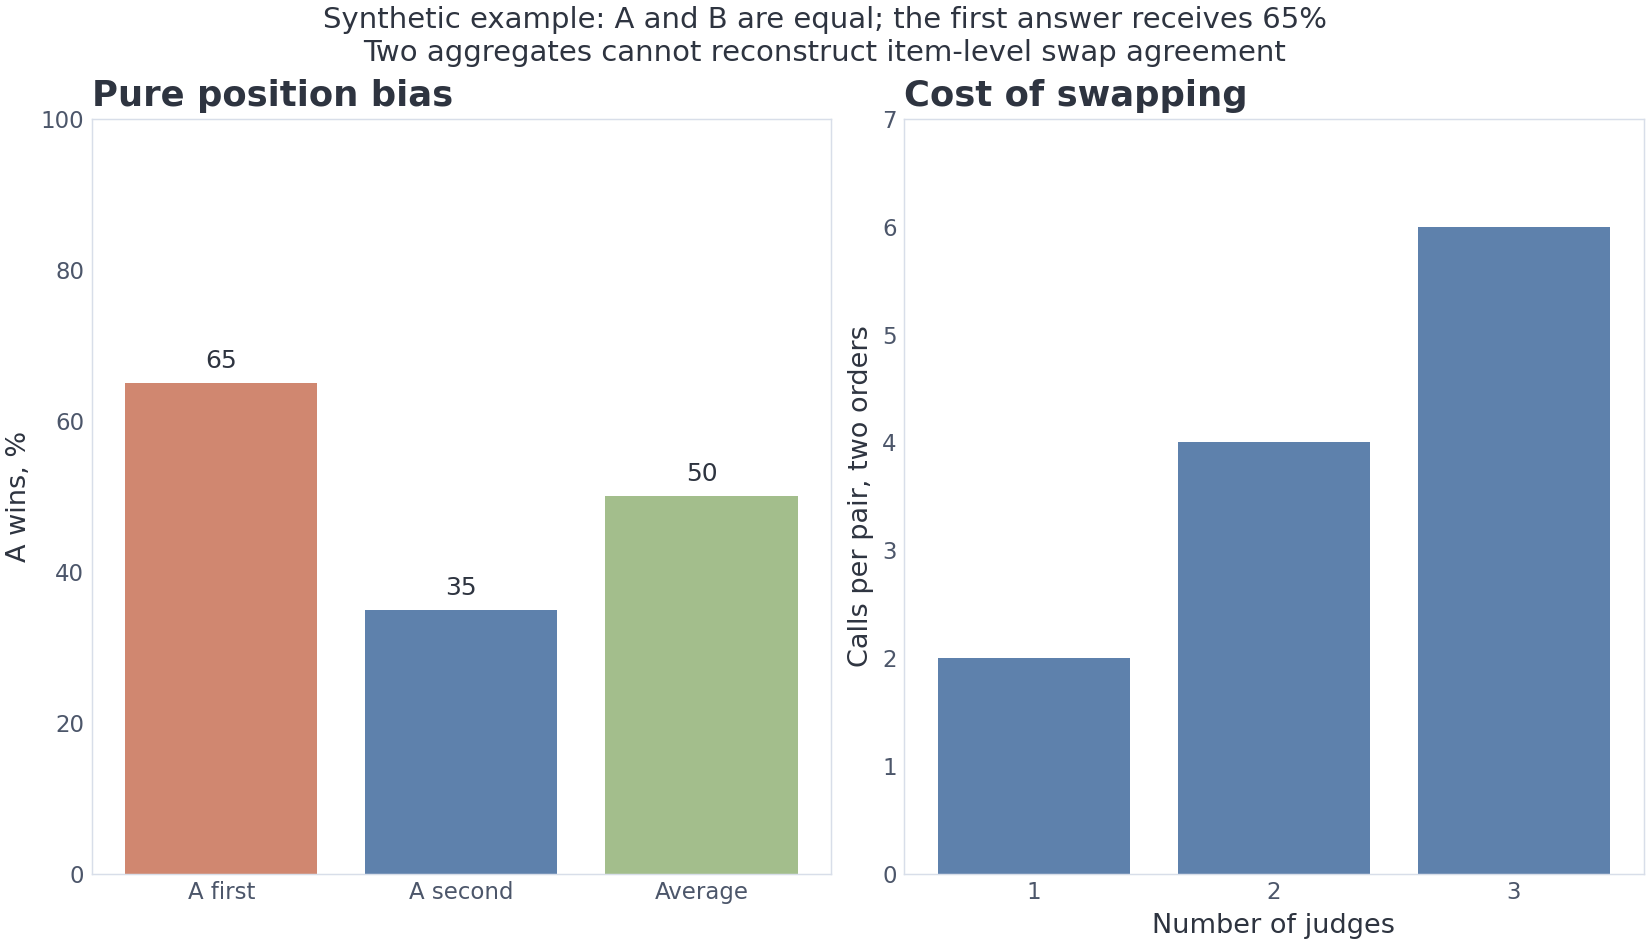
Consider an intentionally simple scenario. Candidate systems are equally good, but the judge favors whichever response appears first by 15 percentage points. The first position therefore wins 65% of comparisons.
If A is always shown first, the report says A wins 65% to 35%—a false 30-point advantage. When the order is reversed, A wins only 35%. Averaging both orderings restores 50%.
A robust swap protocol maps positional labels back to candidate identity.
- If the same candidate wins in both orders, the preference is consistent.
- If the judge always chooses the first position, the identity-level verdict conflicts and the pair becomes an abstention.
- If one ordering produces a tie, the protocol preserves both outcomes and applies a predeclared rule.
Two ties produce tie; conflicting verdicts or a tie in only one order produce abstain. Report these separately. The aggregate counts 650 and 350 cannot reconstruct agreement for individual pairs. Returning to 50% is an expectation under this pure position-bias model, not a general cure.
Swapping diagnoses dependence on position. A stronger protocol also includes:
- an explicit rubric and anchor examples;
- hidden model identities;
- length control or a separate verbosity analysis;
- calibration against human judgments;
- multiple judge families for high-stakes decisions;
- reported disagreement and abstention rates;
- explicit cost.
Three judges evaluated in two orders create six model calls per pair. A 500-pair golden set therefore requires 3,000 judge calls. Judge quality and judge cost belong in the result passport.
11. Multimodal capability, safety, truthfulness, and honesty are not one axis
A composite “intelligence” score can hide properties that move in opposite directions.
Multimodal evaluation
A vision-language system should be evaluated separately for perception, knowledge, reasoning, robustness, multilinguality, and safety. VHELM standardizes inference and spans nine aspects. The multidimensional view matters because chart reasoning can improve while robustness to a small visual change remains poor.
Safety evaluation
HarmBench provides a standardized framework for automated red teaming and robust refusal. Safety is not equivalent to refusal rate. A useful system must reject genuinely harmful requests while continuing to answer benign ones. Agent safety also includes actions: a harmless-looking final message does not excuse a dangerous intermediate tool call.
Truthfulness, honesty, and calibration
TruthfulQA tests whether models reproduce common human misconceptions. That behavior depends on knowledge and response policy. MASK makes a different distinction: whether a model’s belief is correct and whether it reports what it believes are separate questions.
MASK elicits a model’s answers in one setting and compares them with responses under pressure. This is an operational measure based on observable behavior across prompts, not direct access to internal beliefs or distributions.
A product evaluation may therefore need independent measures for factual correctness, calibration, willingness to admit missing evidence, robustness to false premises, tool-result faithfulness, and action safety.
The lesson is not to maximize the number of benchmarks. It is to prevent an average from erasing the failure mode that matters most.
Calibration in Section 5 asks whether numerical confidence matches observed correctness frequencies. It is distinct from both the truth of an individual claim and an honest expression of uncertainty. A decision to abstain requires recorded confidence estimates, checked outcomes, and separate validation of the threshold.
12. Long context: accepted length versus usable evidence
A context-window specification tells us that a system accepts an input. It does not tell us how uniformly the model retrieves, aggregates, or reasons over that input.
NIAH — Needle-in-a-Haystack is a useful basic addressability test, but retrieving one distinctive string is a weak proxy for real document work. RULER adds multiple needles, tracing, and aggregation. NoCha uses long narratives and global understanding. LongBench v2 includes realistic tasks over documents, dialogue history, repositories, and structured data.
Position also matters. Lost in the Middle found that relevant evidence placed near the beginning or end was often used more effectively than evidence in the middle.
The module’s numerical example is a synthetic profile, not a measurement of a named model:
Accuracy is 0.95 at both edges and 0.60 in the center. Mean accuracy is
Define the above-threshold position share as the share of positions satisfying . Then
The inequality selects two intervals, and . Under a uniform position distribution, their combined measure corresponds to approximately 246,752 positions in a hypothetical million-token window. These are two disjoint edge regions, not a contiguous usable window of that length.
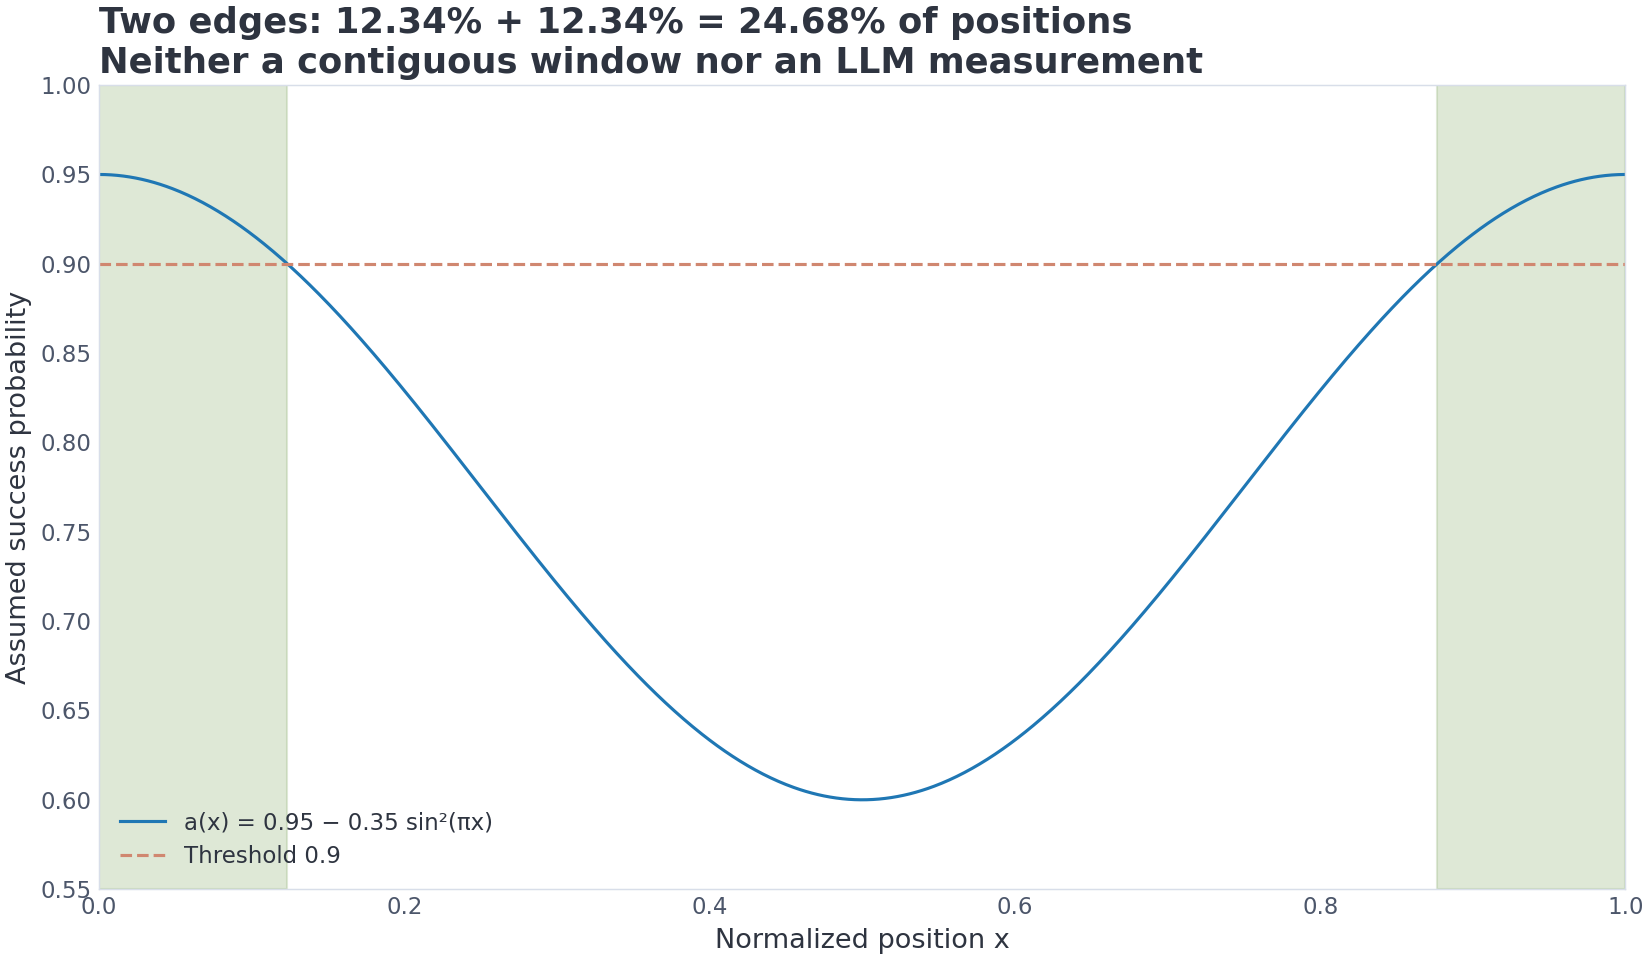
There is no task-independent “real context size.” The answer depends on retrieval versus aggregation, number and position of evidence pieces, document format, answer length, retrieval assistance, prompt design, reasoning budget, and the chosen quality threshold.
A good long-context report plots performance across lengths, positions, and task types instead of reporting only the maximum accepted input.
13. A minimal evaluation harness: one call, one observed output
An evaluation harness connects a model, examples, and metrics. Its most important elementary contract is:
For a fixed system revision, each example and trial ID identifies one saved response.
The small example uses one trial. A pass@k evaluation needs multiple explicit trials, all counted in its budget. The output is stored and every metric is computed from that same observation. Calling a stochastic model separately for exact match, a judge, and a length metric would evaluate different generations while pretending they were one answer.
Here exact_match ignores case and leading or trailing whitespace; it is not byte-for-byte equality. Internal whitespace and punctuation still matter. The notebook also defines normalized_exact_match, which applies Unicode NFKC, collapses internal whitespace, and strips specified terminal punctuation. Choose the scoring policy before comparing systems.
import math
from dataclasses import dataclass
from typing import Callable, Mapping, Sequence

@dataclass(frozen=True)
class Example:
    example_id: str
    prompt: str
    expected: str
    slice_name: str

    def __post_init__(self):
        if any(not isinstance(v, str) or not v.strip()
               for v in (self.example_id, self.prompt, self.expected, self.slice_name)):
            raise ValueError("example fields must be non-empty strings")

def exact_match(prediction: str, expected: str) -> float:
    return float(prediction.strip().casefold() == expected.strip().casefold())

def evaluate(
    model_fn: Callable[[str], str],
    dataset: Sequence[Example],
    metrics: Mapping[str, Callable[[str, str], float]],
) -> dict:
    dataset = tuple(dataset)
    if not callable(model_fn) or not metrics or any(not isinstance(k, str) or not k or not callable(v) for k, v in metrics.items()):
        raise ValueError("supply a callable model and named callable metrics")
    if not dataset:
        raise ValueError("dataset must be non-empty")
    if any(not isinstance(ex, Example) for ex in dataset):
        raise TypeError("expected Example records")
    if len({ex.example_id for ex in dataset}) != len(dataset):
        raise ValueError("example_id values must be unique")

    records = []
    for ex in dataset:
        prediction = model_fn(ex.prompt)  # the only model call for this item
        if not isinstance(prediction, str):
            raise TypeError("model response must be text")
        scores = {
            name: metric(prediction, ex.expected)
            for name, metric in metrics.items()
        }
        if any(isinstance(v, bool) or not isinstance(v, (float, int)) or not math.isfinite(v) or not 0 <= v <= 1 for v in scores.values()):
            raise ValueError("metric scores must be finite numbers in [0, 1]")
        records.append({
            "id": ex.example_id,
            "slice": ex.slice_name,
            "expected": ex.expected,
            "prediction": prediction,
            "scores": scores,
        })

    aggregate = {
        name: sum(row["scores"][name] for row in records) / len(records)
        for name in metrics
    }
    return {
        "records": records,
        "aggregate": aggregate,
        "model_calls": len(records),
    }
This is not yet a production platform, but it already preserves unique item IDs, raw predictions, slices, multiple metrics over one output, and the call count. This minimal kernel stops on a model or metric error. The full notebook distinguishes a declared model-failure score of zero from a metric implementation error, which invalidates the aggregate (None). An evaluator bug must not silently become a model-quality result.
A mature harness adds model and prompt versions, sampling parameters, latency, cost, failures, traces, and budgets.
Planning the golden-set size
For an expected success rate and desired 95% half-width , a normal planning approximation is
It gives 683 examples for a three-point half-width and 246 for five points. These numbers describe the overall rate, not every rare slice. Critical low-frequency cases should be deliberately oversampled and reported separately.
What a canary can tell us
A canary is a marker placed in protected data and searched for where it should not appear. For one exact independent guess, a uniformly random 32-character hexadecimal canary has chance-match probability
Exact reproduction is strong evidence that the system encountered the string through some channel: training, logs, a cache, prompt leakage, or another data path. It does not by itself identify the channel or prove pretraining contamination. Canaries complement provenance and access controls.
For possible matches, the union bound is . A string derived from a public seed or known text has no such secrecy. The notebook uses a public deterministic marker with negative and planted positive controls; it tests the detector, not data privacy.
Interpreting conditional compute accounting
For 700 examples averaging 400 input and 150 output tokens, total token volume is 385,000. A dense -per-token estimate for an 8.03B model is
At an assumed effective 495 TFLOP/s, the conditional arithmetic equivalent is 12.49 seconds. Real wall-clock time includes autoregressive decode, batching, network calls, tools, scheduling, and judges. This is neither a strict latency bound nor evidence that frequent runs are affordable. It assumes one effective throughput for prompt processing and decode, although their execution differs. Measure duration and monetary cost on the target stack.
15. A private golden set in seven deliberate steps
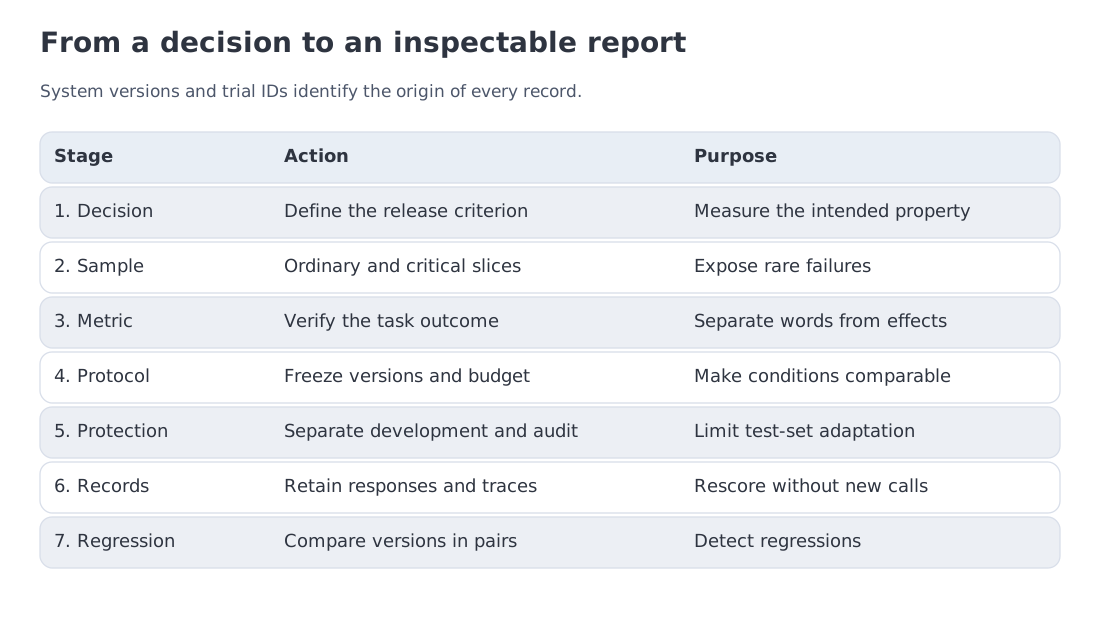
Public benchmarks position a system in the general landscape. A private golden set determines whether it serves your product.
Step 1: state the decision and unit of analysis
Is the result selecting a model, approving a prompt revision, gating a release, or tuning a router? The unit may be a response, a conversation, an agent trajectory, a document, or a user session.
Step 2: sample the product distribution
Include common requests and deliberately oversample rare critical cases. Report both natural-weighted performance and slice results. A set made only of adversarial examples is valuable for red teaming but does not estimate normal user experience.
Step 3: choose a metric that matches the task
Classification can use accuracy or F1. Structured outputs need schema and semantic-field checks. Code should be executed against hidden tests in a sandbox. Open-ended responses need human pairwise comparison or a calibrated judge. Agents need final environment state, trajectory quality, failures, cost, and repeatability.
Step 4: freeze the protocol before seeing the outcome
Record the model revision, system prompt, tools, temperature, retry policy, reasoning budget, judge rubric, and failure handling. Otherwise protocol tuning can silently choose the winner.
Step 5: protect the held-out data
Keep the decisive split out of training corpora, public examples, and logs reused for training. Canaries detect some leakage paths, but provenance, access control, and data-retention policy remain primary.
Repeatedly inspected regression cases gradually become development data even if they never enter weight training. Prompt selection based on their errors is still adaptation. Separate development cases, regression tests, and a rarely opened final audit split. Repeated testing also raises the chance of a spurious win; predeclare primary metrics and release criteria.
Step 6: retain trajectories and failure causes
For agents, final success is too coarse. Save tool calls, intermediate state, retries, errors, and recovery. A system may reach the goal through an unsafe action, or fail because the environment—not the model—was defective.
Step 7: turn evaluation into continuous regression testing
CI/CD — Continuous Integration and Continuous Delivery can run a fast subset on every change and a full suite before release. Prompt edits, retrieval-index changes, tool updates, and dependency upgrades can regress behavior independently of the weights.
The platform is secondary to the contracts. lm-evaluation-harness is widely used for academic tasks; Inspect AI supports configurable and safety-oriented evaluations; OpenAI Evals provides programmable eval patterns; LangSmith, Langfuse, and Phoenix support trajectory observability. Whatever the stack, preserve versions, raw records, and reproducible reports.
16. Eight directions shaping evaluation as of 10 October 2026
Rather than memorizing a current list of “best benchmarks,” track the directions changing measurement practice.
1. Living and refreshed datasets
LiveBench, LiveCodeBench, and domain-specific variants reduce the contamination window. Scores must be tied to a benchmark version and date because successive releases are not identical experiments.
2. Private and centrally executed evaluation
Private ARC-AGI splits and some professional suites retain evaluation material or run submissions centrally. This reduces direct tuning pressure while increasing the need to trust and document the organizer’s infrastructure.
3. Controlled mutation and counterfactual items
Benchmark mutation changes surface form while preserving a verifiable target skill. It can separate memorization from generalization, but the mutation procedure itself needs validation.
4. Trajectories replace terminal answers
SWE-bench, OSWorld, and -bench evaluate changes to an environment. Newer variants such as SWE-bench Pro and OSWorld 2.0 extend horizon and professional complexity. Longer trajectories raise the importance of repeatability, environment state, and complete logs.
OSWorld 2 provides a concrete example: the checked osworld-v2.1 release of 16 September 2026 pins coordinated task, asset, website, and environment-image revisions. Mixing releases changes the experiment even if the agent name stays fixed. Source: OSWorld-V2 release history.
5. Cost and efficiency enter the metric
ARC-AGI includes efficiency constraints, and agent evaluations increasingly report cost, latency, and trial count. A system that succeeds after hundreds of expensive attempts is not equivalent to one that succeeds reliably on the first run.
6. Judges receive their own evaluations
Position, verbosity, style, shortcut, and self-preference biases have made judge calibration a separate discipline. Judge reports increasingly include human agreement, swap consistency, rubric version, and failure analysis.
7. Rankings become personalized or pluralistic
Aggregate human preference hides heterogeneous users. Personalized and pluralistic leaderboards recognize that “best” depends on audience, language, and task distribution. That framing is closer to product selection than a universal ordering.
8. Evaluation cards and evidence passports
A result is increasingly packaged with benchmark family, version, split, metric, scaffold, cost, and uncertainty. The unit of trust is moving from a leaderboard cell to a structured evidence object.
Across all eight directions, confidence moves away from the benchmark name and toward protocol completeness and inspectable artifacts.
17. Read two passports: the benchmark and the reported run
Before using a score, fill in two linked records.
Benchmark passport
- What capability or behavior is intended to be measured?
- How many items and which slices are included?
- How and when were the items created?
- How were labels verified and disputes handled?
- Is the test public, private, refreshed, or centrally executed?
- What does the metric aggregate and conceal?
- Is the benchmark still discriminative for the systems being compared?
Result passport
- exact model revision;
- system prompt and message format;
- tools, retrieval, and scaffold;
- decoding parameters, trials, and
pass@k; - reasoning effort and context budget;
- answer extraction;
- judge, rubric, and presentation order;
- item-level outcomes, intervals, and paired tests;
- cost, latency, and evaluation date;
- harness code and dependency versions.
This mirrors Module 18. There, the scaffold transformed a model into an agent. Here, the harness transforms tasks into evidence about a system. In both cases, the model name alone is insufficient.
20. Key takeaways, course finale, and sources
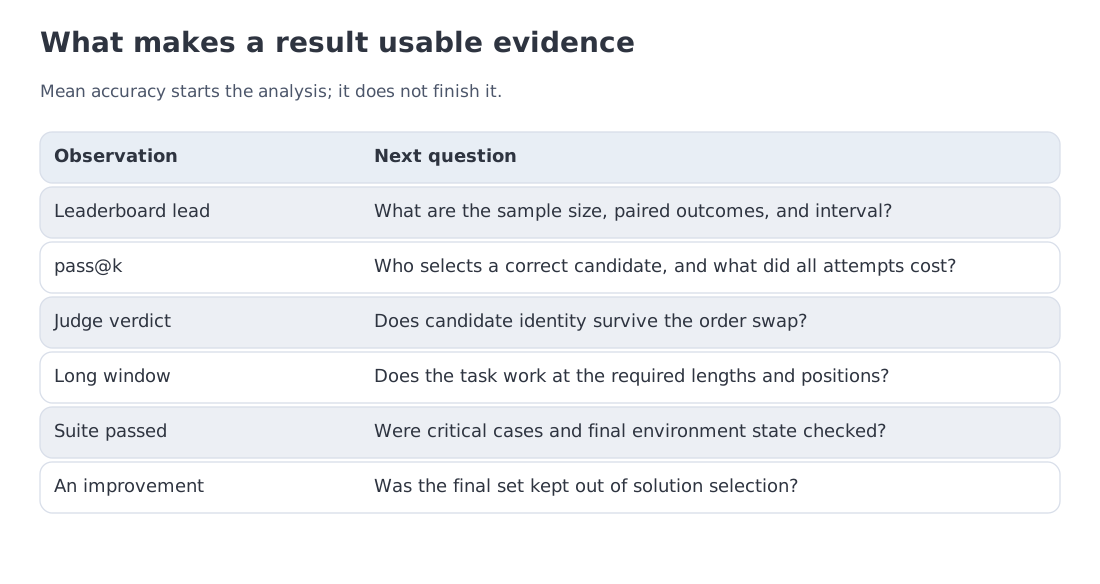
Modern LLM evaluation is a chain of evidence, not a hunt for one authoritative number.
- Start from the decision. Desired behavior and acceptable risk determine the task set.
- Separate model, system, and product. A public score normally describes one configuration, not every deployment.
- Read the benchmark life cycle. Protocol adaptation, contamination, saturation, and item defects reduce discriminating power.
- Keep item-level outcomes. Paired evidence is more informative than two independent means.
- Report uncertainty. In the teaching scenario, assumed probabilities 95.5% and 95.0% at N=500 give , not a decisive victory.
- Use finite-sample
pass@k. It measures the chance of finding a solution, not repeatable agent reliability. - Audit LLM judges. Swapping, rubrics, human calibration, and disagreement reporting belong to the result.
- Distinguish nominal and working context. Performance depends on length, position, task, and threshold.
- Build a private golden set. Public benchmarks map the field; private evidence makes the product decision.
- Run evaluation continuously. Prompts, retrieval, tools, serving changes, and dependencies can regress independently of model weights.
Primary sources
-
BIG-bench — Beyond the Imitation Game
-
MMLU-Pro — A More Robust and Challenging Multi-Task Benchmark
-
LiveBench — A Challenging, Contamination-Limited LLM Benchmark
-
LiveCodeBench — Holistic and Contamination-Free Code Evaluation
-
Chatbot Arena — An Open Platform for Human Preference Evaluation
-
MT-Bench / LLM-as-a-judge — Judging LLM-as-a-Judge
-
Humanity’s Last Exam — arxiv.org/abs/2501.14249
-
HLE-Verified — arxiv.org/abs/2602.13964
-
FrontierMath — arxiv.org/abs/2411.04872
-
ARC-AGI-2 — official technical report
-
ARC-AGI-3 — official description
-
SWE-bench — Can Language Models Resolve Real-World GitHub Issues?
-
SWE-bench Pro — arxiv.org/abs/2509.16941
-
OSWorld — arxiv.org/abs/2404.07972
-
-bench — arxiv.org/abs/2406.12045
-
Lost in the Middle — arxiv.org/abs/2307.03172
-
RULER — arxiv.org/abs/2404.06654
-
NoCha — arxiv.org/abs/2406.16264
-
LongBench v2 — arxiv.org/abs/2412.15204
-
VHELM — arxiv.org/abs/2410.07112
-
HarmBench — arxiv.org/abs/2402.04249
-
TruthfulQA — arxiv.org/abs/2109.07958
-
MASK — arxiv.org/abs/2503.03750
-
lm-evaluation-harness — github.com/EleutherAI/lm-evaluation-harness
-
Inspect AI — github.com/UKGovernmentBEIS/inspect_ai
-
OpenAI Evals — github.com/openai/evals
-
Arena naming — official announcement
-
Exact McNemar inference — statsmodels documentation
From evaluation to the full mathematical model
Nineteen modules have covered the entire stack: tokenization, attention, MoE, data, pretraining, serving, post-training, multimodality, retrieval, agents, and finally evidence about system behavior. The course’s recurring idea is causal integration: architecture, data, optimization, runtime, and evaluation must be understood together. A change is an improvement only when its consequences are measured elsewhere in the stack.
The additional Module 20 now assembles the model computation: tokens, a forward distribution, a loss, a weight update, and generation. Its numerical example checks the pieces together, while comparisons with SSMs and diffusion establish the scope of the final expression. Module 3 remains the place to revisit Transformer foundations.
Landscape verified: 10 October 2026. The lecture intentionally omits a current frontier leaderboard: those values change faster than a stable course and depend on scaffold version, inference budget, and evaluation date. All numerical examples in Sections 6, 8, 10, 12, and 13 belong to the frozen educational contract and are not measurements of named external models.